Ultrasound for Research · RF data

Beamformed RF data for ultrasound research

Most commercial ultrasound systems are closed and give researchers no access to raw RF signals — yet these signals carry valuable information about how acoustic waves interact with tissue. TELEMED research tools give biomedical engineers real-time access to beamformed RF data in C++, MATLAB, Python and LabVIEW.

Works with (option for EXT-1H/CEXT-1H scanners)
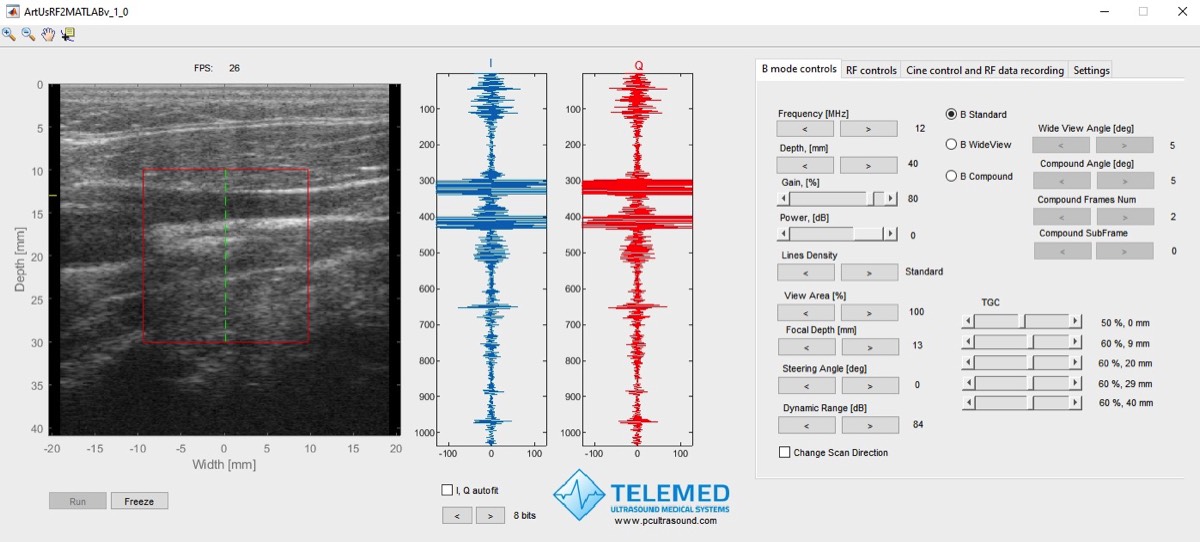
MATLAB ArtUs RF Data Control showing a B-mode image and RF signals in real time

4 environments

C++, MATLAB, Python, LabVIEW

B + RF

Two streams in real time

Record & review

RF data files with acquisition parameters

Source code

Scripts and manuals included

Beamformed RF data acquisition path

With the RF module option, beamformed RF data can be taken from four points of the receive path — from the beamformer output to I/Q data after the Hilbert transform.

ArtUs EXT-1H, EXT-2H and CEXT-1H with RF module — beamformed RF signal pathArtUs EXT-1H, EXT-2H and CEXT-1H with the RF module option. Scanning is controlled through the TELEMED SDK and RF Data Control II (scan type, steering, depth, focus, frequency, gain, power, TGC, dynamic range, view area, line density and iContrast). Transmit pulses are the standard B-mode pulses and are not user-defined. Receive path: analog front end and ADC, beamformer, TFC (time-frequency control) filter, angle apodization and Hilbert transform. Beamformed RF data can be accessed at four source points: ID 1 beamformer output, ID 2 TFC filter output, ID 3 angle apodization output, ID 4 I/Q after the Hilbert transform. Individual channel RF data before beamforming is not accessible.SCANNING CONTROLScan settings through the TELEMED SDKTELEMED SDKRF Data Control IIScan parametersScan type: B Standard · WideView · CompoundCompound angle & frames · Steering angleDepth · Focus · FrequencyB Gain · B Power · TGCDynamic range · View area · Lines densityiContrast · Scan directionTX electronicsStandard B-mode pulsesNOT USER-DEFINEDArtUs transducerTransmit + receiveRECEIVE / DATA PATHBeamformed RF data access pointsRF MODULE OPTIONEcho signalsAnalog front end + ADCGain · AGC · filtersBeamformerDelay-and-sumTFC filterAngle apodizationHilbert transformI + Q outputNO ACCESSChannel RF dataNot available withthe RF module optionSOURCE ID 1Beamformed RF (I)Beamformer outputSOURCE ID 2Beamformed RF (I)TFC filter outputSOURCE ID 3Beamformed RF (I)Angle apodizationoutputSOURCE ID 4I + Q dataHilbert transformoutput ArtUs EXT-1H, EXT-2H and CEXT-1H with RF module — beamformed RF signal pathArtUs EXT-1H, EXT-2H and CEXT-1H with the RF module option. Scanning is controlled through the TELEMED SDK and RF Data Control II (scan type, steering, depth, focus, frequency, gain, power, TGC, dynamic range, view area, line density and iContrast). Transmit pulses are the standard B-mode pulses and are not user-defined. Receive path: analog front end and ADC, beamformer, TFC (time-frequency control) filter, angle apodization and Hilbert transform. Beamformed RF data can be accessed at four source points: ID 1 beamformer output, ID 2 TFC filter output, ID 3 angle apodization output, ID 4 I/Q after the Hilbert transform. Individual channel RF data before beamforming is not accessible.SCANNING CONTROLTELEMED SDKRF Data Control IIScan parametersScan type: B Standard · WideView · CompoundCompound angle & frames · Steering angleDepth · Focus · FrequencyB Gain · B Power · TGCDynamic range · View area · Lines densityiContrast · Scan directionTX electronicsStandard B-mode pulsesNOT USER-DEFINEDArtUs transducerTransmit + receiveEcho signalsRECEIVE / DATA PATHRF MODULE OPTIONAnalog front end+ ADCGain · AGC · filtersNO ACCESSChannel RF dataNot available withthe RF module optionBeamformerDelay-and-sumSOURCE ID 1Beamformed RF (I)Beamformer outputTFCfilterSOURCE ID 2Beamformed RF (I)TFC filter outputAngleapodizationSOURCE ID 3Beamformed RF (I)Angle apodizationoutputHilberttransformI + Q outputSOURCE ID 4I + Q dataHilbert transformoutput
Simplified signal path of ArtUs EXT-1H, EXT-2H and CEXT-1H with the RF module option. Beamformed RF data is available at four source points and can be recorded in real time. Data formats: ID 1–3 — 16-bit RF; ID 4 — I + Q, 16 + 16-bit. Transmit pulses are the standard B-mode pulses and cannot be user-defined. Individual channel RF data before beamforming is not accessible on these systems either. User-defined transmit pulses and channel RF data are available on the ArtUs USS-2H research system.
DataAccess pointPurpose
Beamformed RF dataSource ID 1Beamformer outputRF immediately after the receive beamformer (summation) stage.
Beamformed RF dataSource ID 2TFC filter outputBeamformed RF after the TFC (time-frequency control) filter, which adapts filtering to imaging depth.
Beamformed RF dataSource ID 3Angle apodization outputBeamformed RF after the angle apodization stage.
I + Q dataSource ID 4Hilbert transform outputComplex I/Q representation after the Hilbert transform stage.

What RF data makes possible

Access to raw RF signals opens new directions for both engineering research and clinical practice.

Engineering

  • Novel quantitative ultrasound methods for tissue characterisation
  • Investigation of the acoustic properties of tissue and tissue-mimicking materials
  • New parametric imaging techniques
  • Advanced image processing algorithms for speckle reduction and image enhancement

Clinical practice

  • New biomarkers to recognise, characterise and differentiate lesions and to assess treatment, e.g. thermal ablation efficiency or sonoporation
  • In-vitro studies of tissue, e.g. biopsy samples
  • New sources of contrast for imaging tumours, tissue fibrosis, atherosclerotic plaques and more
  • Higher-quality diagnostic images for visual expert evaluation

New

Color flow and spectral Doppler from RF data

ArtUs EXT-1H and EXT-2H with the RF module now go beyond B-mode: RF data is also available in color Doppler and pulsed wave Doppler scanning. You get the raw data behind the color flow map (CFM) and the Doppler spectrum — and full freedom to process it yourself.

  • Real-time RF data in B, B + color Doppler and B + PW Doppler scan modes
  • Separate controls for color Doppler and PW Doppler RF acquisition
  • Develop and test your own Doppler processing — clutter filters, velocity estimation, spectral analysis and flow quantification

Available with the next release of ArtUs RF Data Control II.

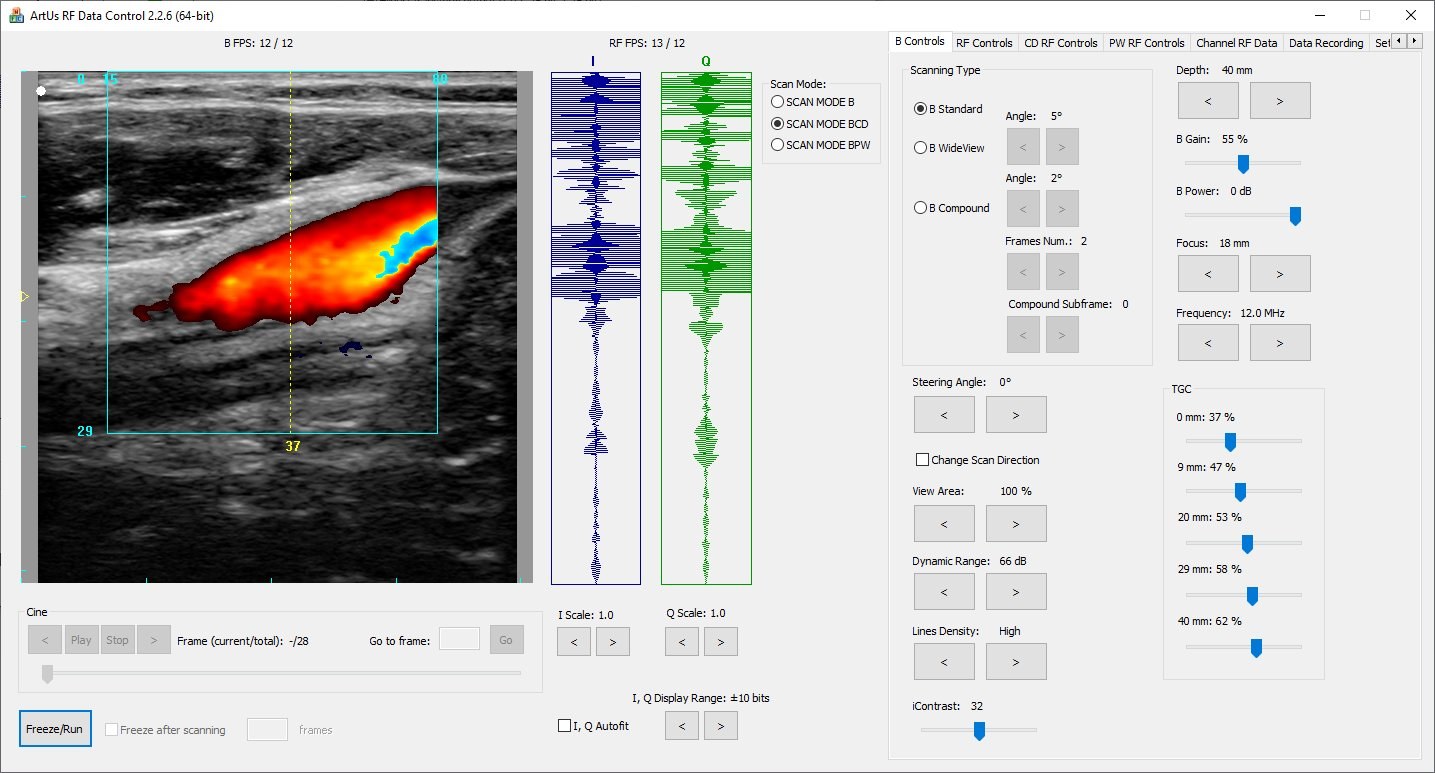
ArtUs RF Data Control II acquiring RF data in color Doppler scan mode: color flow image of a vessel with I and Q RF signals
ArtUs RF Data Control II in color Doppler scan mode — color flow image and I/Q RF signals in real time.

The research package

Graphical tools to acquire RF data in real time, record it to file and review it offline — plus scripts that demonstrate the conventional signal processing steps of B-mode image formation. Click any screenshot to see it full size.

Real-time acquisition — RF Data Control

View B-mode and RF streams in real time, set scanning parameters, define a region of interest and record RF data to disk.

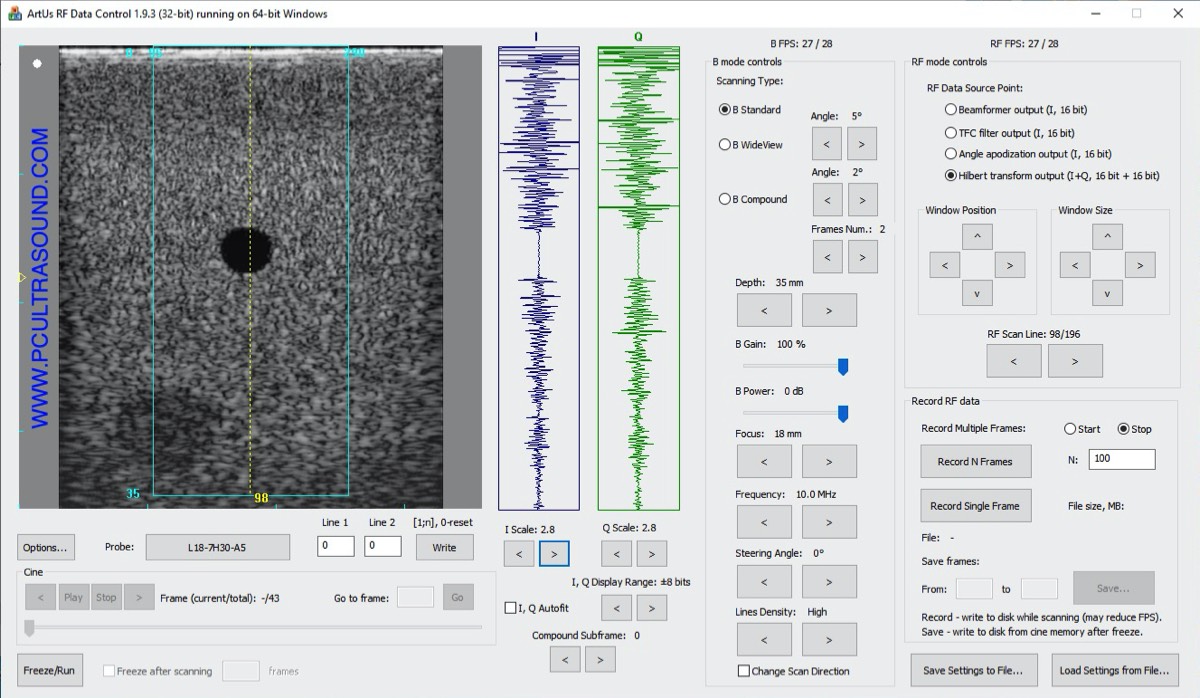
C++ ArtUs RF Data Control
C++Fig. 1

ArtUs RF Data Control

Standalone C++ application for real-time B + RF acquisition and recording.

MATLAB ArtUs RF Data Control
MATLABFig. 3

ArtUs RF Data Control

The same real-time acquisition and recording, directly inside MATLAB.
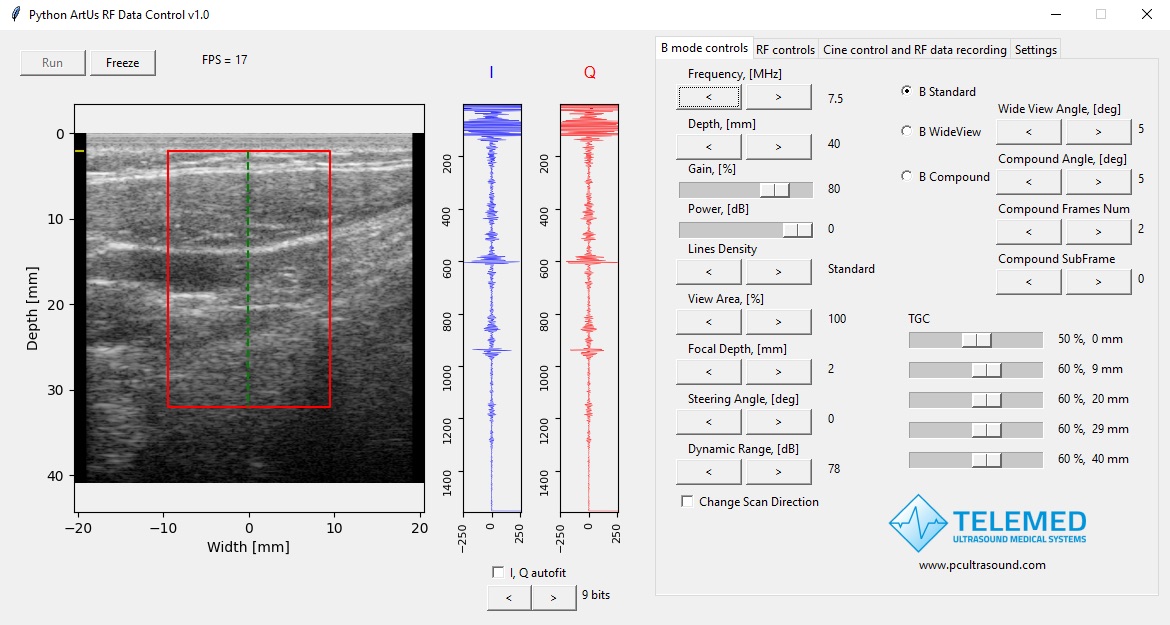
Python ArtUs RF Data Control
PythonFig. 4

ArtUs RF Data Control

Real-time acquisition and recording in a Python application.
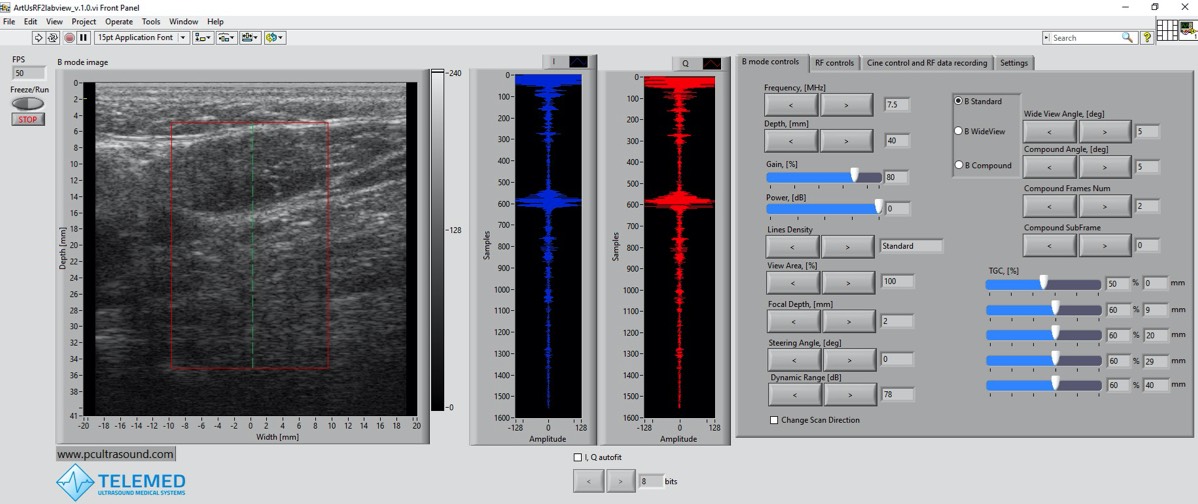
LabVIEW ArtUs RF Data Control
LabVIEWFig. 5

ArtUs RF Data Control

Real-time acquisition and recording in a LabVIEW application.

Offline review

Load recorded RF data files together with the main acquisition parameters.
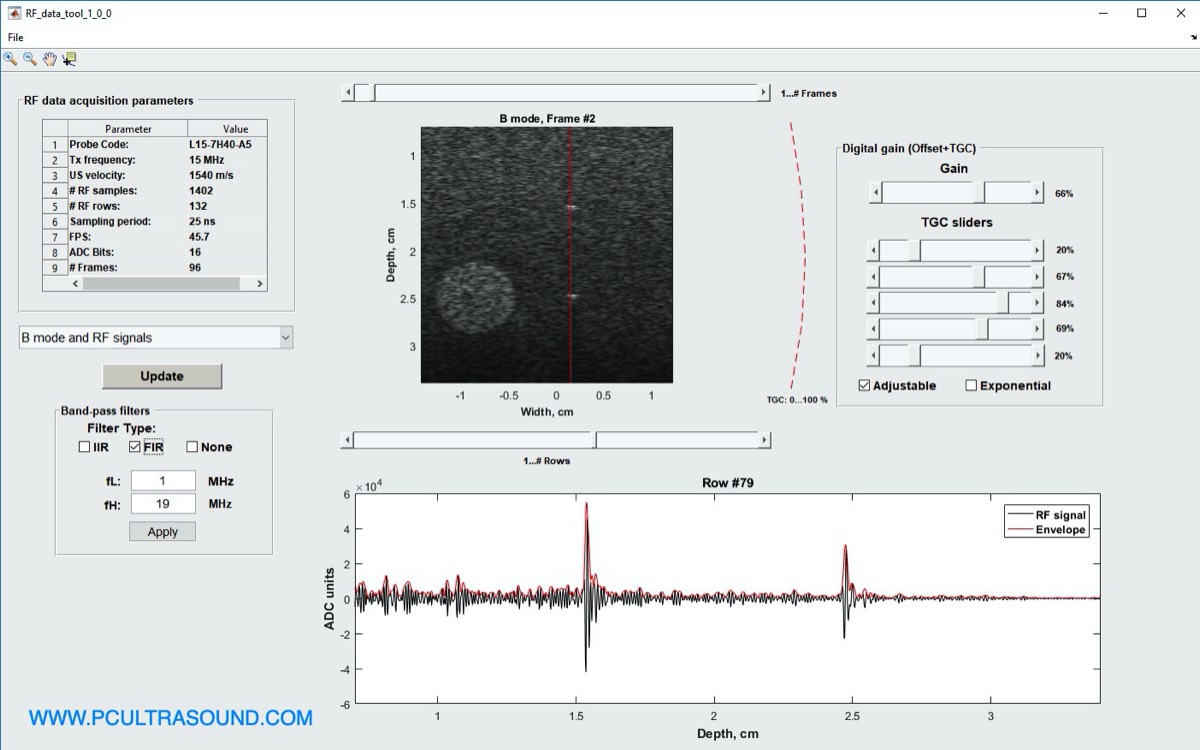
MATLAB RF Data tool
MATLABFig. 2

RF Data tool

Import recorded RF data and acquisition parameters into MATLAB for review.
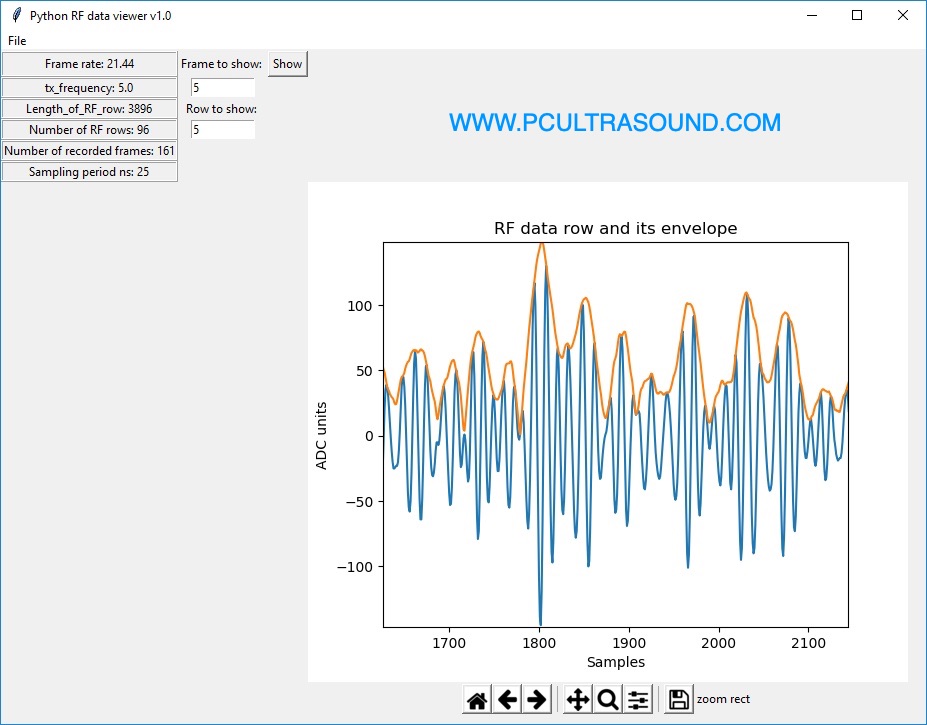
Python RF Viewer tool
PythonFig. 9

RF Viewer

Load and view recorded RF data in Python.

Signal processing

See how each processing step shapes the final B-mode image.
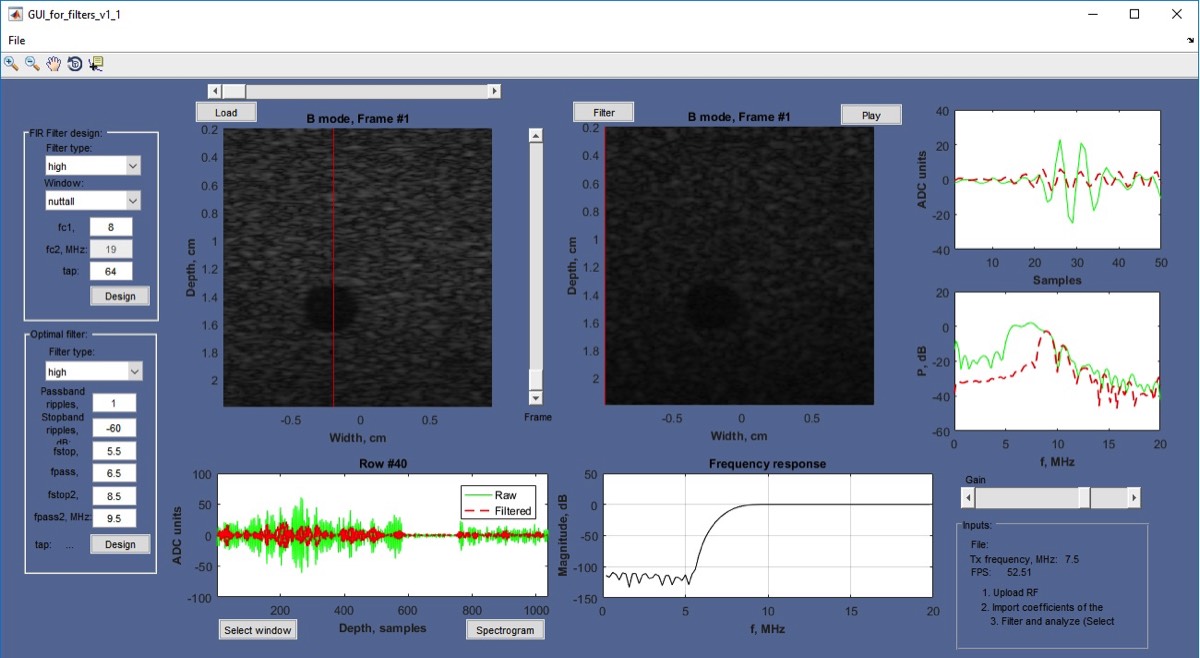
MATLAB Filters Analysis tool
MATLABFig. 6

Filters Analysis

Design filters in a GUI and see how filtering the RF signals changes the B-mode image.
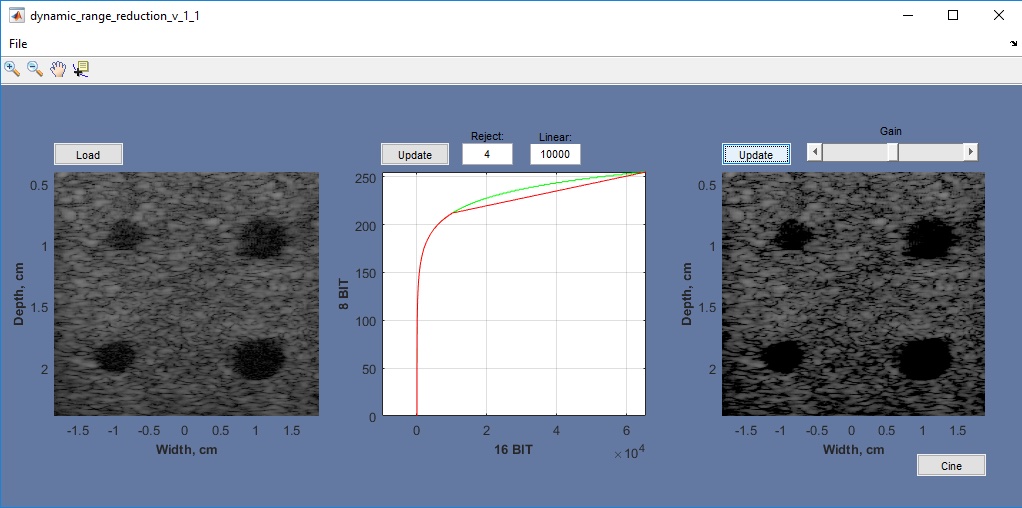
MATLAB Dynamic Range control tool
MATLABFig. 7

Dynamic Range control

Adjust the dynamic range reduction curve and observe its effect on the image.
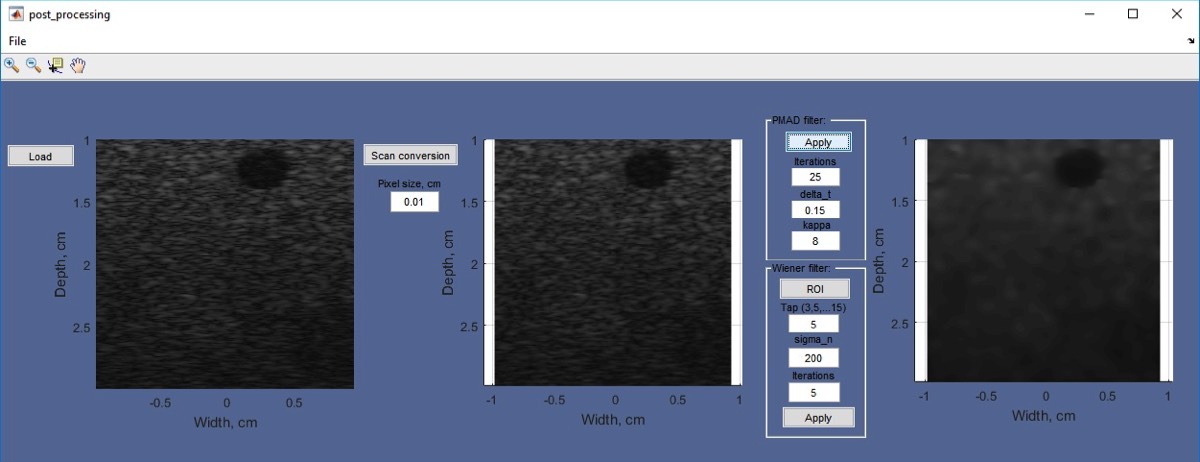
MATLAB Postprocessing control tool
MATLABFig. 8

Postprocessing control

Filter speckle noise and compare the results.

Get the research tools

Tools, MATLAB and Python scripts, source code and manuals are available for download.